
Table of Contents
- Why This Document Matters More Than Any YouTube Recommendation
- The Riskometer: Your First Checkpoint
- Expense Ratio: The Number That Compounds Silently
- Benchmark and Performance: What to Actually Compare
- AUM, Exit Load, and Fund Manager Details
- Portfolio Composition: What Are You Actually Buying?
- A Worked Walkthrough
- Common Mistakes
- Myth vs Fact
- Expert Tips
- Checklist
- FAQs
Introduction
Somebody in a WhatsApp group recommends a mutual fund. You open the app, find the fund page, and there’s a “factsheet” PDF link sitting there, mostly ignored, full of numbers and terms nobody explained to you. This guide fixes that specific gap — a plain-English walkthrough of exactly what to look at on a mutual fund factsheet, in what order, before you decide whether a fund deserves your money.
Why This Document Matters More Than Any YouTube Recommendation
A factsheet is the fund house’s own official, SEBI-mandated summary of a fund — its risk level, costs, holdings, performance, and manager. It’s not marketing copy; it’s a standardized disclosure document every fund is required to publish, typically monthly. Learning to read it takes less time than most people think, and it’s the single most reliable way to check whether a fund someone recommended actually matches what you’re looking for.
Because every fund house is required to follow the same broad disclosure format under SEBI’s regulations, a factsheet from one AMC is structured similarly to a factsheet from a completely different AMC — once you’ve learned to read one factsheet properly, you can read almost any fund’s factsheet with the same confidence, regardless of which fund house published it. That consistency is exactly what makes this a genuinely learnable, one-time skill rather than something you need to relearn for every new fund you consider.
The Riskometer: Your First Checkpoint
Every factsheet displays a Riskometer — a visual scale (Low to Very High) that SEBI requires every mutual fund to disclose, reflecting the fund’s risk level based on its portfolio composition and category.
Check this first, before anything else. If a fund’s riskometer shows “Very High” and you were expecting something conservative, that mismatch alone tells you this isn’t the right fund for your goal, regardless of how good its recent returns look.
Expense Ratio: The Number That Compounds Silently
This is usually near the top of the factsheet, expressed as a percentage (e.g., “1.85%” or “0.20%”). It’s the annual fee the fund charges, deducted automatically from the fund’s returns — you never see a separate bill, which is exactly why it’s easy to overlook.
Why it matters more than it looks: a 1.5% difference in expense ratio, compounded over 15-20 years, meaningfully affects your final corpus even if two funds’ underlying gross performance is identical. Always compare this number directly across any funds you’re considering — see our detailed comparison of index funds vs actively managed funds for how this plays out specifically.
Benchmark and Performance: What to Actually Compare
Every factsheet lists a benchmark index (e.g., Nifty 50 TRI, Nifty Midcap 150 TRI) that the fund measures itself against, along with trailing returns (1-year, 3-year, 5-year, since inception).
What to actually do with this:
– Never judge a fund by 1-year returns alone — this window is too short and too easily dominated by a lucky or unlucky market cycle.
– Compare the fund’s return against its OWN benchmark, not against a completely different fund category — a mid-cap fund should be compared to a mid-cap benchmark, not the Nifty 50.
– Look at 3-year and 5-year rolling performance relative to the benchmark, not just the single trailing number, if the factsheet or fund house website provides it — consistency across periods matters more than one strong year.
AUM, Exit Load, and Fund Manager Details
- AUM (Assets Under Management) — the total money the fund currently manages. A very small or rapidly shrinking AUM can be a caution flag (potential liquidity or sustainability concerns), while an extremely large AUM in certain fund categories (like small-cap) can sometimes limit the manager’s flexibility. Neither extreme is automatically disqualifying, but both are worth noting.
- Exit load — a fee charged if you redeem your investment before a specified holding period (commonly 1 year for many equity funds, though this varies by fund). Check this before investing if you might need the money sooner than the exit load window.
- Fund manager and tenure — how long the current manager has actually run this specific fund. A fund’s impressive 5-year track record means less if the current manager only took over 6 months ago.
Standard deviation and Sharpe ratio, in plain English
Further down many factsheets, you’ll find two numbers that sound more intimidating than they are. Standard deviation measures how much a fund’s returns have bounced around its own average — a higher number means a bumpier ride, even if the average return looks similar to a smoother fund. Sharpe ratio measures how much return a fund generated for each unit of risk it took on — a higher Sharpe ratio generally means the fund delivered its returns more efficiently, without needing as much volatility to get there.
Neither number needs to be memorized precisely — what matters is using them comparatively. Between two funds with similar returns, the one with a lower standard deviation and a higher Sharpe ratio has generally delivered a smoother, more risk-efficient ride, which matters more to most investors than it might initially seem, especially during a market downturn when a bumpier fund can feel far more stressful to hold onto.
Portfolio Composition: What Are You Actually Buying?
The factsheet lists the fund’s top holdings (usually top 10) and sector allocation. This is where you actually see what you’re buying, beyond the fund’s name and category label.
What to check:
– Concentration — does a small number of stocks or one sector dominate the portfolio disproportionately? Higher concentration means higher risk, even within a diversified-sounding fund category.
– Overlap with funds you already own — if you’re building a portfolio of multiple funds, check whether their top holdings substantially overlap, which quietly reduces the diversification benefit you think you’re getting.
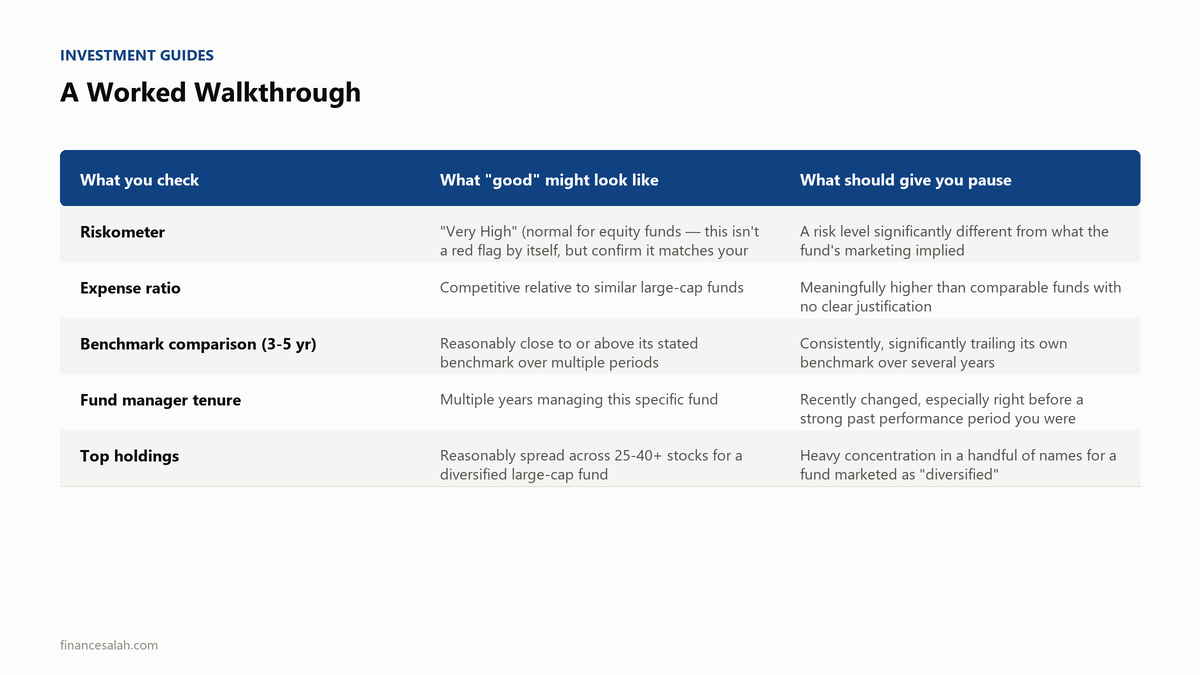
A Worked Walkthrough
Imagine you’re evaluating a large-cap equity fund’s factsheet:
| What you check | What “good” might look like | What should give you pause |
|---|---|---|
| Riskometer | “Very High” (normal for equity funds — this isn’t a red flag by itself, but confirm it matches your risk tolerance) | A risk level significantly different from what the fund’s marketing implied |
| Expense ratio | Competitive relative to similar large-cap funds | Meaningfully higher than comparable funds with no clear justification |
| Benchmark comparison (3-5 yr) | Reasonably close to or above its stated benchmark over multiple periods | Consistently, significantly trailing its own benchmark over several years |
| Fund manager tenure | Multiple years managing this specific fund | Recently changed, especially right before a strong past performance period you were attracted to |
| Top holdings | Reasonably spread across 25-40+ stocks for a diversified large-cap fund | Heavy concentration in a handful of names for a fund marketed as “diversified” |
This is illustrative reasoning, not investment advice for any specific fund — always look at the actual current factsheet for any fund you’re evaluating.
The same walkthrough applied to a debt fund
The exact same checklist applies to a debt fund factsheet, but a couple of items shift in emphasis. The riskometer for a debt fund typically shows “Low” to “Moderate” rather than “Very High,” and that’s expected, not a sign of a weak fund — debt funds are structurally lower-risk than equity funds. What matters more here is the credit quality of the underlying holdings (how much is invested in high-rated versus lower-rated bonds) and the fund’s average maturity, since these two factors drive most of a debt fund’s risk profile — information usually found in the same portfolio composition section where an equity fund lists its top stock holdings. A debt fund holding predominantly high-rated government and corporate bonds with a short average maturity is generally lower-risk than one holding lower-rated corporate debt with a longer maturity, even if both are labeled as similar fund categories.
Where a factsheet falls short, and what to check elsewhere
A factsheet is comprehensive, but it’s a snapshot — it doesn’t tell you about a fund house’s overall track record across its full suite of funds, any regulatory actions against the AMC, or qualitative factors like the fund manager’s stated investment philosophy in their own words. For serious due diligence beyond the factsheet itself, checking the AMC’s own investor communications, the fund’s Scheme Information Document (SID) in full (not just the factsheet summary), and independent fund-rating platforms alongside the factsheet gives you a more rounded picture than the factsheet alone.
Common Mistakes
- Only looking at the headline 1-year return and ignoring everything else on the factsheet.
- Not checking the riskometer at all, then being surprised by volatility that was disclosed the entire time.
- Ignoring expense ratio because “it’s just a small percentage” — small percentages compound significantly over long horizons.
- Not checking who’s actually managing the fund right now, attributing historical performance to a manager who’s already left.
- Comparing a fund’s performance against the wrong benchmark or category, making an apples-to-oranges judgment.
Myth vs Fact
| Myth | Fact |
|---|---|
| “A mutual fund factsheet is too technical for a regular investor to understand.” | The key sections — riskometer, expense ratio, benchmark comparison, top holdings — are specifically designed to be readable by retail investors, once you know what to look for. |
| “Higher AUM always means a better, safer fund.” | AUM size has tradeoffs depending on fund category — very large AUM in a small-cap fund, for instance, can sometimes constrain the manager’s flexibility rather than purely indicating quality. |
| “A fund’s 1-year return is the most important number on the factsheet.” | Short-term returns are heavily influenced by market timing luck — 3-5 year performance against the benchmark, combined with expense ratio and risk level, gives a much fuller picture. |
| “Exit load doesn’t matter if I plan to hold long-term anyway.” | It’s still worth checking and understanding upfront, since financial circumstances change and you may need to redeem earlier than originally planned. |
Expert Tips
- Download the factsheet directly from the fund house’s or AMFI’s official website, rather than relying solely on a third-party app’s summarized version, to see the complete, standardized disclosure.
- Compare 2-3 factsheets side by side within the same fund category before deciding — relative comparison within a category is far more useful than evaluating one fund in isolation.
- Re-check the factsheet at least annually for funds you already hold — fund manager changes, expense ratio revisions, and portfolio drift can all happen after your initial investment.
- Don’t chase the fund with the single best recent return — check whether that performance has been reasonably consistent across market cycles, not just one favorable period.
- Use standard deviation and Sharpe ratio as comparative tools, not standalone verdicts — they’re most useful when comparing two similar funds side by side, not when judging a single fund in isolation.
- Cross-reference the factsheet’s holdings against the fund’s stated investment mandate — a fund marketed as “large-cap focused” holding a meaningful chunk of mid-cap or small-cap stocks is worth a closer look at why.
Checklist
- [ ] Check the Riskometer against your own risk tolerance
- [ ] Note the expense ratio and compare it to similar funds in the same category
- [ ] Compare 3-5 year returns against the fund’s own stated benchmark
- [ ] Check the fund manager’s tenure on this specific fund
- [ ] Note the exit load and holding period
- [ ] Review top holdings and sector concentration
- [ ] Check for overlap with other funds you already hold
Frequently Asked Questions
Q: Where can I find a mutual fund’s factsheet?
A: Factsheets are published monthly on the fund house’s (AMC’s) official website, and are also often accessible via AMFI’s website or your investment platform’s fund detail page.
Q: What is the most important thing to check on a factsheet as a beginner?
A: Start with the Riskometer to confirm the fund’s risk level matches your expectations, then check the expense ratio and how the fund’s returns compare to its own benchmark over multiple time periods, not just one year.
Q: What does expense ratio actually mean?
A: It’s the annual fee (as a percentage of your investment) that the fund charges to manage your money, deducted automatically from the fund’s returns rather than billed separately.
Q: Why does fund manager tenure matter?
A: A fund’s historical performance is often attributed to whoever managed it during that period — if the current manager only recently took over, that past track record may be less relevant to future performance.
Q: What is exit load?
A: It’s a fee charged if you redeem your investment before a specified minimum holding period, commonly around 1 year for many equity funds, though this varies by scheme — always check the current exit load structure before investing.
Q: What is Sharpe ratio and why does it matter?
A: Sharpe ratio measures how much return a fund generated per unit of risk taken — a higher Sharpe ratio generally indicates the fund delivered its returns more efficiently, which is useful for comparing two funds with similar headline returns but different volatility.
Q: How often should I check a mutual fund’s factsheet after I’ve already invested?
A: At least annually is a reasonable minimum, since fund manager changes, expense ratio revisions, and gradual portfolio drift can all happen after your initial investment and are worth periodically reconfirming.
Q: Is a lower AUM always a red flag for a mutual fund?
A: Not automatically — a smaller, newer fund can still be well-managed, but a very small or consistently shrinking AUM is worth investigating further, since it can sometimes signal underlying liquidity or investor-confidence concerns.
Q: Should I trust a fund recommendation without checking its factsheet myself?
A: It’s generally worth checking the factsheet yourself regardless of the source of the recommendation, since even well-intentioned recommendations from friends or influencers may not account for your specific risk tolerance and goals.
Q: Do factsheets look different for debt funds compared to equity funds?
A: The overall structure is the same, but the emphasis shifts — debt fund factsheets place more weight on credit quality of holdings and average maturity, while equity fund factsheets emphasize stock-level concentration and sector allocation.
Conclusion
A mutual fund factsheet looks intimidating mainly because nobody walks through it section by section the first time. Once you know to check the riskometer, expense ratio, benchmark-relative performance, fund manager tenure, and portfolio concentration — in that order — evaluating any fund becomes a genuinely manageable 10-minute exercise instead of an intimidating PDF you scroll past.
Before your next investment, pull up that fund’s actual current factsheet and work through this checklist. If you’re still deciding between index and active funds generally, FinanceSalah’s comparison guide covers that broader decision, and our guide on starting your first SIP is the natural next step once you’ve picked a fund you’re confident in.
Sources & Further Reading
- SEBI — Mutual Fund Disclosure Norms — official riskometer and disclosure requirements
- AMFI — Association of Mutual Funds in India — factsheet access and industry data
- Value Research / Fund House Official Factsheets — always cross-check against the official AMC-published document
Related Reading
- How to Start a SIP With ₹500 in India
- Index Funds vs Actively Managed Mutual Funds in India
- How to Open a Demat Account in India Step by Step
- NPS vs PPF vs Mutual Fund for Retirement
- Realistic Plan to Build Wealth on ₹30,000 Salary in India
- Passive Income Ideas in India With ₹10,000
This article is for general educational purposes and does not constitute personalized investment advice. Always review the current, official factsheet of any specific fund before investing, and consult a registered financial advisor for guidance specific to your situation.